Introduction
Leveraging “real-world” observational data sources, often sourced by reusing routinely collected data (i.e., secondary use), to infer causality offers great opportunities for informing health policy while raising some challenges for its implementation. Applying such a causal framework often implies the need for detailed sensitive individual-level data in order to mitigate confounding. Conducting causal research across national borders consequently brings challenges in terms of sensitive data access and interoperability. The use case defined within the BY-COVID project aimed to ensure interoperability across national borders by enabling a federated approach complying with privacy and data protection regulations. This showcase presents the proposed methodology, and subsequently applies it to a policy-relevant research question (i.e., investigating the real-world effectiveness of the SARS-CoV-2 primary vaccination program in populations spanning different countries), aiming to facilitate a rapid response in the case of a next pandemic.
Who is the showcase intended for?
The proposed methodology provides step-by-step guidance for researchers assessing causal public health research questions directed towards populations crossing (national) borders. Researchers from scientific institutions, providing evidence feeding into public health policy, can benefit from the proposed methodology.
What is the showcase?
The methodological framework for federated causal inference based on real-world observational data sources includes a step-by-step guidance (see Figure 1), from defining a research question, to establishing a causal model, identifying and specifying data requirements in a common data model, generating synthetic data, and developing an interoperable and reproducible analytical pipeline for distributed deployment. It requires close collaboration between a coordinating research team (also referred to as the ‘Coordination Node’) and institutions hosting or being able to acquire access to the required sensitive individual-level data (also referred to as ‘Participant Nodes’).
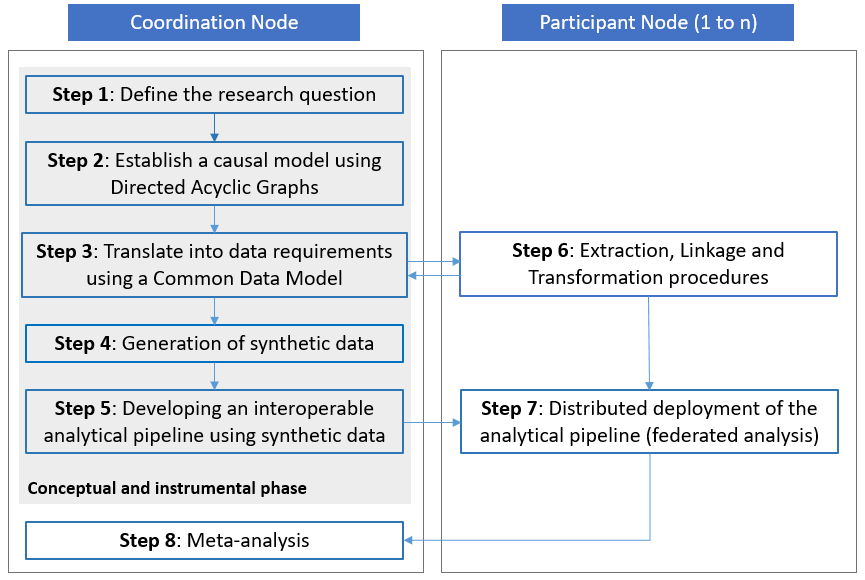
Figure 1. The methodological framework consists of several consecutive steps. Step 1 to 5 are part of a ‘conceptual and instrumental phase’ within the framework and are conducted by the Coordination Node without access to real-world data. Steps 6 and 7 involve the extraction, transformation and analysis of real-world data within the jurisdiction of each of the Participant Nodes. Step 8 is the final step conducted by the Coordination Node which produces comparable results to inform policy. Source: https://doi.org/10.1186/s12874-023-02068-3.
Building blocks
Defining the research question
The research question needs to be precisely defined following the PICO(T) scheme.
Establishing a causal model
Graphical causal models, such as Directed Acyclic Graphs (DAGs), enables researchers to explicitly state the underlying assumptions that are made to estimate the causal effect of interest. Thereby, it provides a clear and transparent graphical way to identify confounding bias and other potential sources of bias under the described assumptions and subsequently informs the study design and statistical analysis. The DAGitty web application provides an environment for creating, editing, and analysing causal diagrams.
Specifying data requirements
The data requirements (i.e., the variables as identified in the causal model) are captured in a Common Data Model (CDM), detailing syntactic and semantic considerations to achieve interoperability between Participant Nodes. Each of the variables is characterised within the model description of the CDM, including (1) the model entity, (2) the variable label, (2) a description of the variable, (3) the encoding system, (4) the variable format and type, (5) the units of measurement, (6) the requirement level, (7) the variable-level validation rules, (8) the variable properties (observed/calculated), and (9) the possible data sources.
Generating synthetic data
Synthetic data can be simulated by capturing the technical and syntactic requirements as specified in the Common Data Model (CDM) and using either non-informative mathematical distributions or expected distributions based on prior knowledge, thereby avoiding exposure of the real sensitive data.
Developing an interoperable analytical pipeline
The interoperable analytical scripts can be developed using the synthetic data. The analysis should include a comprehensive Data Quality Assessment (DQA), a validation check of compliance with the Common Data Model (CDM) specification, and a descriptive analysis providing characteristics of the study population. The analytics are dependent on the specified research question and can apply different methods to address biases and handle missing data. The analytical pipeline should only produce aggregated results that have lost all sensitive properties, i.e., compliant with disclosure policies.
Extracting, linking and transforming the real-world observational data
Each Participant Node (i.e., institutions hosting or being able to require access to individual-level real-world population, health and care data) is responsible for the data access application process, and the subsequent processing of the data following the guidelines provided by the Common Data Model (CDM) specification. The development and publishing of a Data Management Plan (DMP), for example using Argos’ services, facilitates a rapid data access application process.
Deploying the analytical pipeline
The interoperable analytical pipeline should be distributed and deployed within a secured processing environment (SPE) of each Participant Node. It requires as input the transformed data complying with the Common Data Model (CDM) specification. The pipeline can be provided as single or multiple scripts implementing the statistical analysis using auditable open-source software or can be containerised (e.g., using a Docker container), providing a fixed environment dealing with system and software dependencies.
Data Quality Assurance Framework in the analytical pipeline
The data quality assurance framework is completely reliant on the data quality assurance processes established as part of the data governance framework of the partner institutions participating contribute with their data via their local analysis and share their aggregated outputs to respond to the research question.
Once the data is extracted and transformed by the participants, several data quality checks, both syntactic and semantic, are implemented along the analytical pipeline to ensure input data provided by the partner institutions complies with the common data model specifications in terms of information requirements, format and quality, including compliance with validation requirements on the data needed to complete the statistical analyses for the methodology implemented to respond to the research question proposed. All quality assessments are expected to produce informative outputs enabling the participants to gain valuable insights on their data at different stages of the process for them to correct any reported inconsistencies or issues on the input data. In addition, these outputs accompanying the final survival analysis estimate to help interpreting the results and judge the quality of the inputs and processing. All data quality assessments are additive in nature with the aim of preserving the original input data in accordance with the principles of single-point-of-truth and reproducibility of the outputs.
Quality assurance is supported by a) comprehensive documentation of the common data model specifications, including variable requirement level, validation rules, possible transformations at origin and proposed sources of data, b) a quality data assessment of the input data producing informative outputs, c) a data validation process, checking compliance with the common data model specification, producing informative outputs (i.e., data validation interactive report) and adding relevant quality flags enabling data filtering, d) a data imputation process producing informative outputs (i.e., data imputation evaluation interactive report) and adding complete variables facilitating downstream statistical analyses.
The first step in the pipeline analyses, loading the input data, entails checking the syntactic and semantic compliance with the CDM specification in terms of input file name, format, header structure, variable specification and encoding. This step is conducted at the time of loading the data into a transient database by reading files located within the ‘input’ folder in a standard tree directory with the expected file format and casting each variables’ data types while creating the input data table.
Following this step, a data quality assessment is performed on the input data table to provide direct insights on the original raw data. Contents of this univariate exploratory analysis focuses on a) ‘Dataset statistics’, b) summary statistics and general information for each ‘Variable’, c) a ‘Missing data profile’, d) prespecified ‘Alerts’ at variable level, and e) presence of ‘Duplicate’ registries (see Figure 2).

Figure 2. Data Quality Assessment (DQA) interactive report
The overview of a) ‘Dataset statistics’ focuses on 1) the number of variables, 2) the number of rows (or registries), 3) global number of observations, 4) global number of missing cells, 5) percentage of missing cells (or fields), and 6) file memory usage for the input data file (i.e., input data table).
The univariate exploratory data analysis at b) ‘Variable’ level provides general information on the number of discrete, continuous and complete missing columns in the dataset and on the class of each variable in the input data, and includes additional information on each variable such as an 1) ‘Overview’ with information in the number and percentage of distinct values, and the number and percentage of missing values; 2) a ‘Summary’ with the length, class and mode of the variable for categorical and boolean variables and summary distribution statistics (i.e., min, max, median, mean, 1st and 3rd quartiles) for numeric variables; 3) a list of the existing categories - if the variable is a character or factor variable with under 100 distinct values; and 4) a graphical representation of the distribution of the variable (i.e., histogram or similar) when possible.
The c) ‘Missing data profile’ includes both a table and figure representing the number of registries with missing values (and the percentage of missing values per variable) for each variable. Further information is provided as d) ‘Alerts’ considering the cardinality of variables (i.e., a variable with a constant value, or all registries with unique values) or specific alerts for variables over a prespecified threshold of missing values. Finally, the data quality assessment provides information about the presence or absence of duplicate registries in the input data. Participants are expected to use this information to correct any possible data inaccuracies or inconsistencies by reviewing the extraction and transformation processes producing the input data, or to gain insights for the interpretation of their outputs from the statistical analyses.
Next step in the analytical pipeline after the data quality assessment is applying the data validation rules prespecified in the CDM. All registries are systematically tested against the validation rules and results from this validation are summarised in an interactive report (see Figure 3).
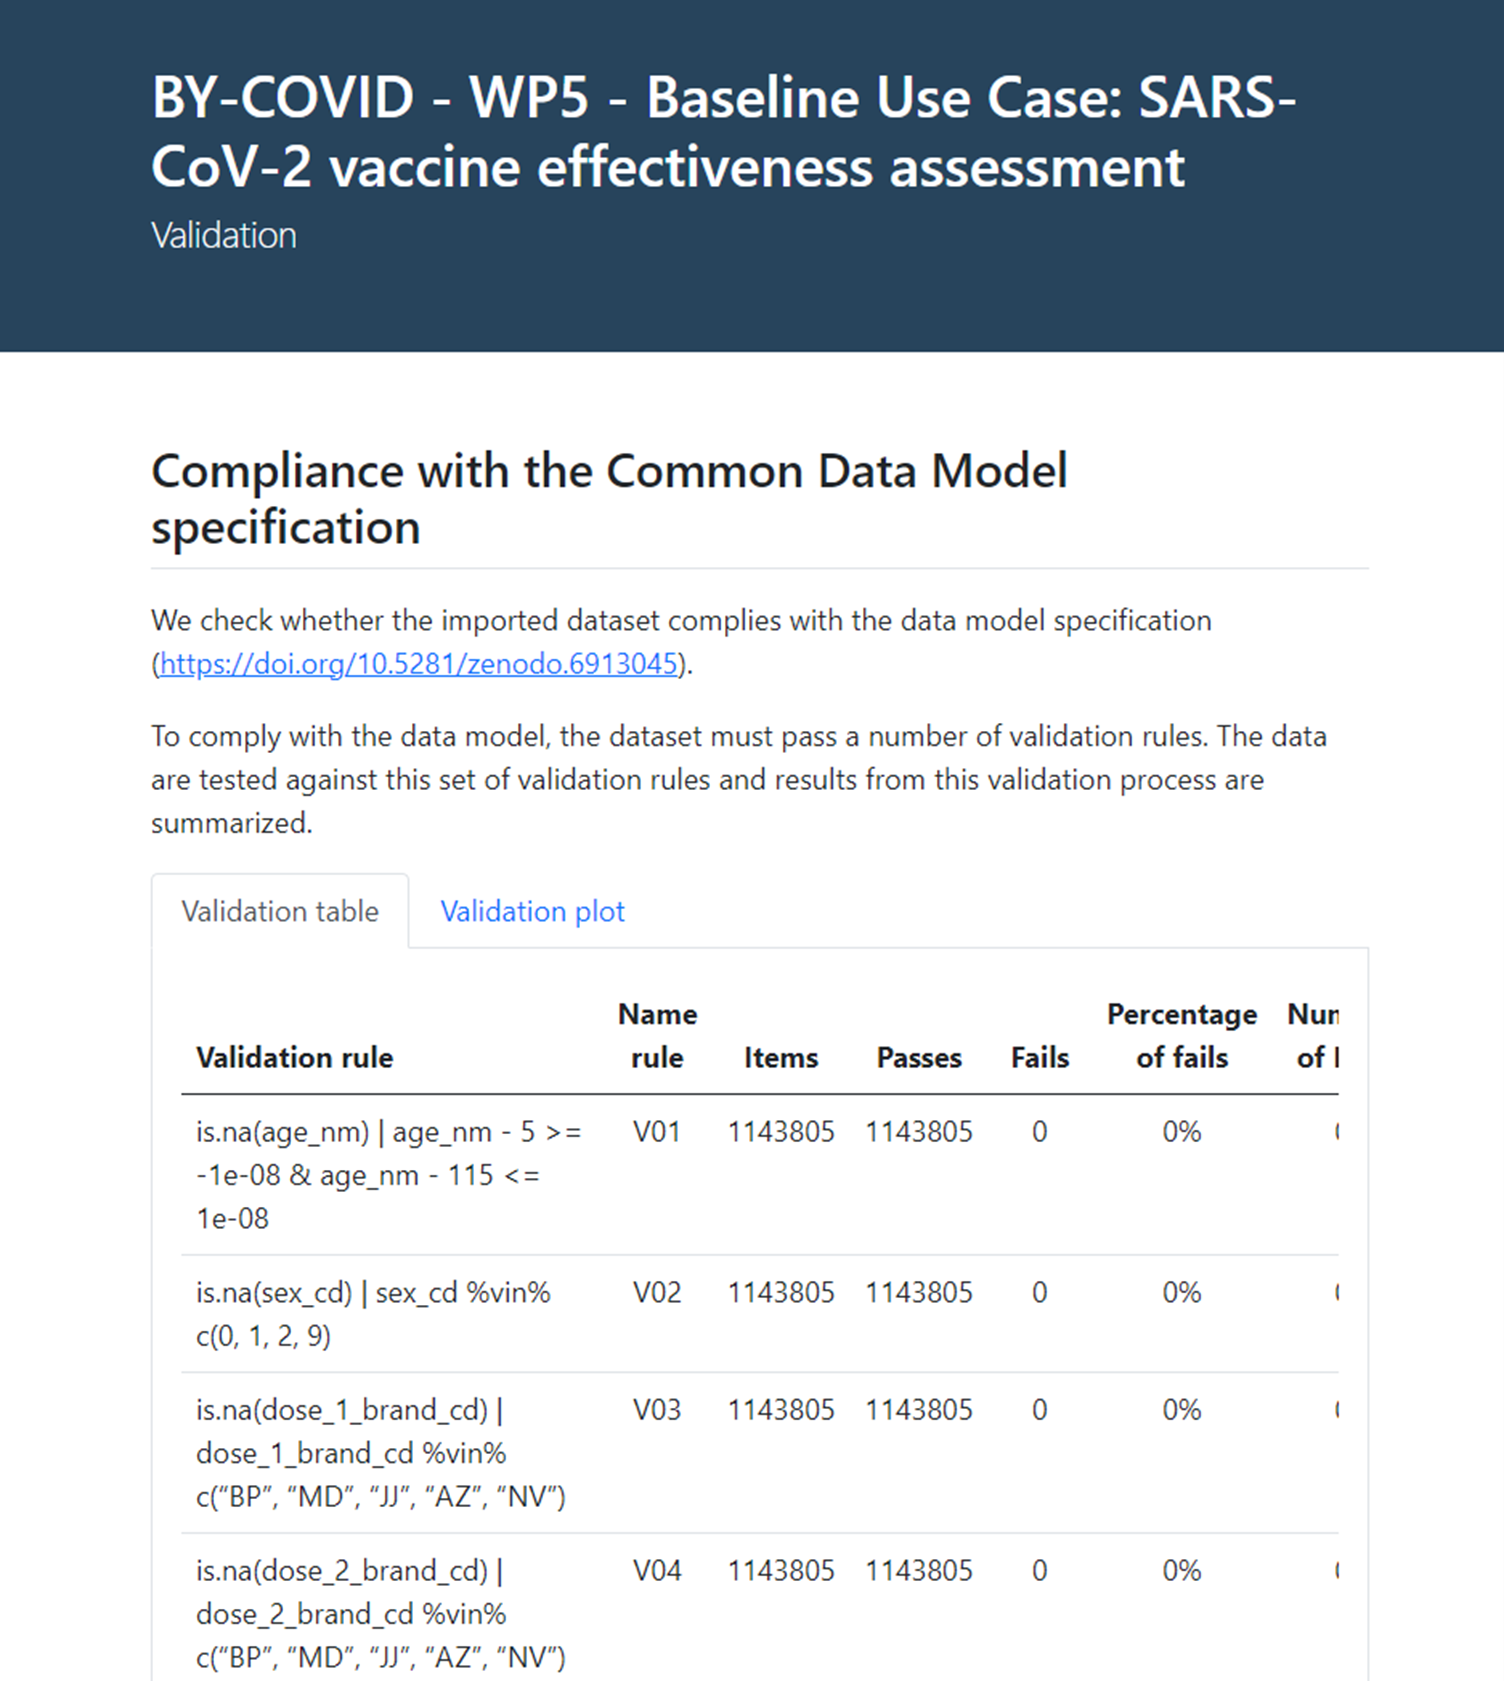
Figure 3. Data validation report
The data validation process is additive so not to change or delete any of the contents of the input data but to add a ‘flag_violating_val’ boolean variable informing whether a registry violates an essential validation rule. Validation rules imposed on the input data are considered essential when non compliance (or violation) of such rule could disable or negatively impact the subsequent analysis.
The data validation report contains a validation compliance table and a validation plot informing on the rationale of each validation rule, their name (label), the number of items or registries for which the rule is applied, the number of registries passing and/or failing the rule, the percentage of failed registries within a variable, the number and percentage of missing values (namely ‘NA’s values), and if the rule has triggered any errors or warnings within the analysis. Non-compliance with the CDM is also informed globally as the number of registries failing a validation rule.
This study is built upon the implementation of a causal model to evaluate the effectiveness of the primary vaccination for COVID-19 at the population level. The methodology to support the analysis required for causal inference, requires establishing counterfactual risks, achieved in this instance by matching similar individuals who completed the primary vaccination with individuals that did not or partially complete a primary vaccination schedule, based on a set of assumed measurable confounders.
Missing values in those variables considered as potential confounders could difficult the matching process and could potentially affect the interpretation of the analyses. That is why, once the data quality and the data validation rules has been assessed, a more detailed analysis is continued on those variables required for the matching process, so considered ‘core’ variables, following a standardised decision tree guiding the imputation process for those variables (see Figure 4 below). Missing values are further categorised. If the probability of being missing is the same for all cases, then the data are said to be missing completely at random (MCAR). If the probability of being missing is the same only within groups defined by the observed data, then the data are missing at random (MAR). The situation where the likelihood of missing data is related to the value of the missing data itself refers to missing not at random (MNAR). In cases where the probability of missing data varies and cannot be fully explained by the observed data, the data are considered non-MAR (non-missing at random), indicating that the missingness may depend on unobserved factors.
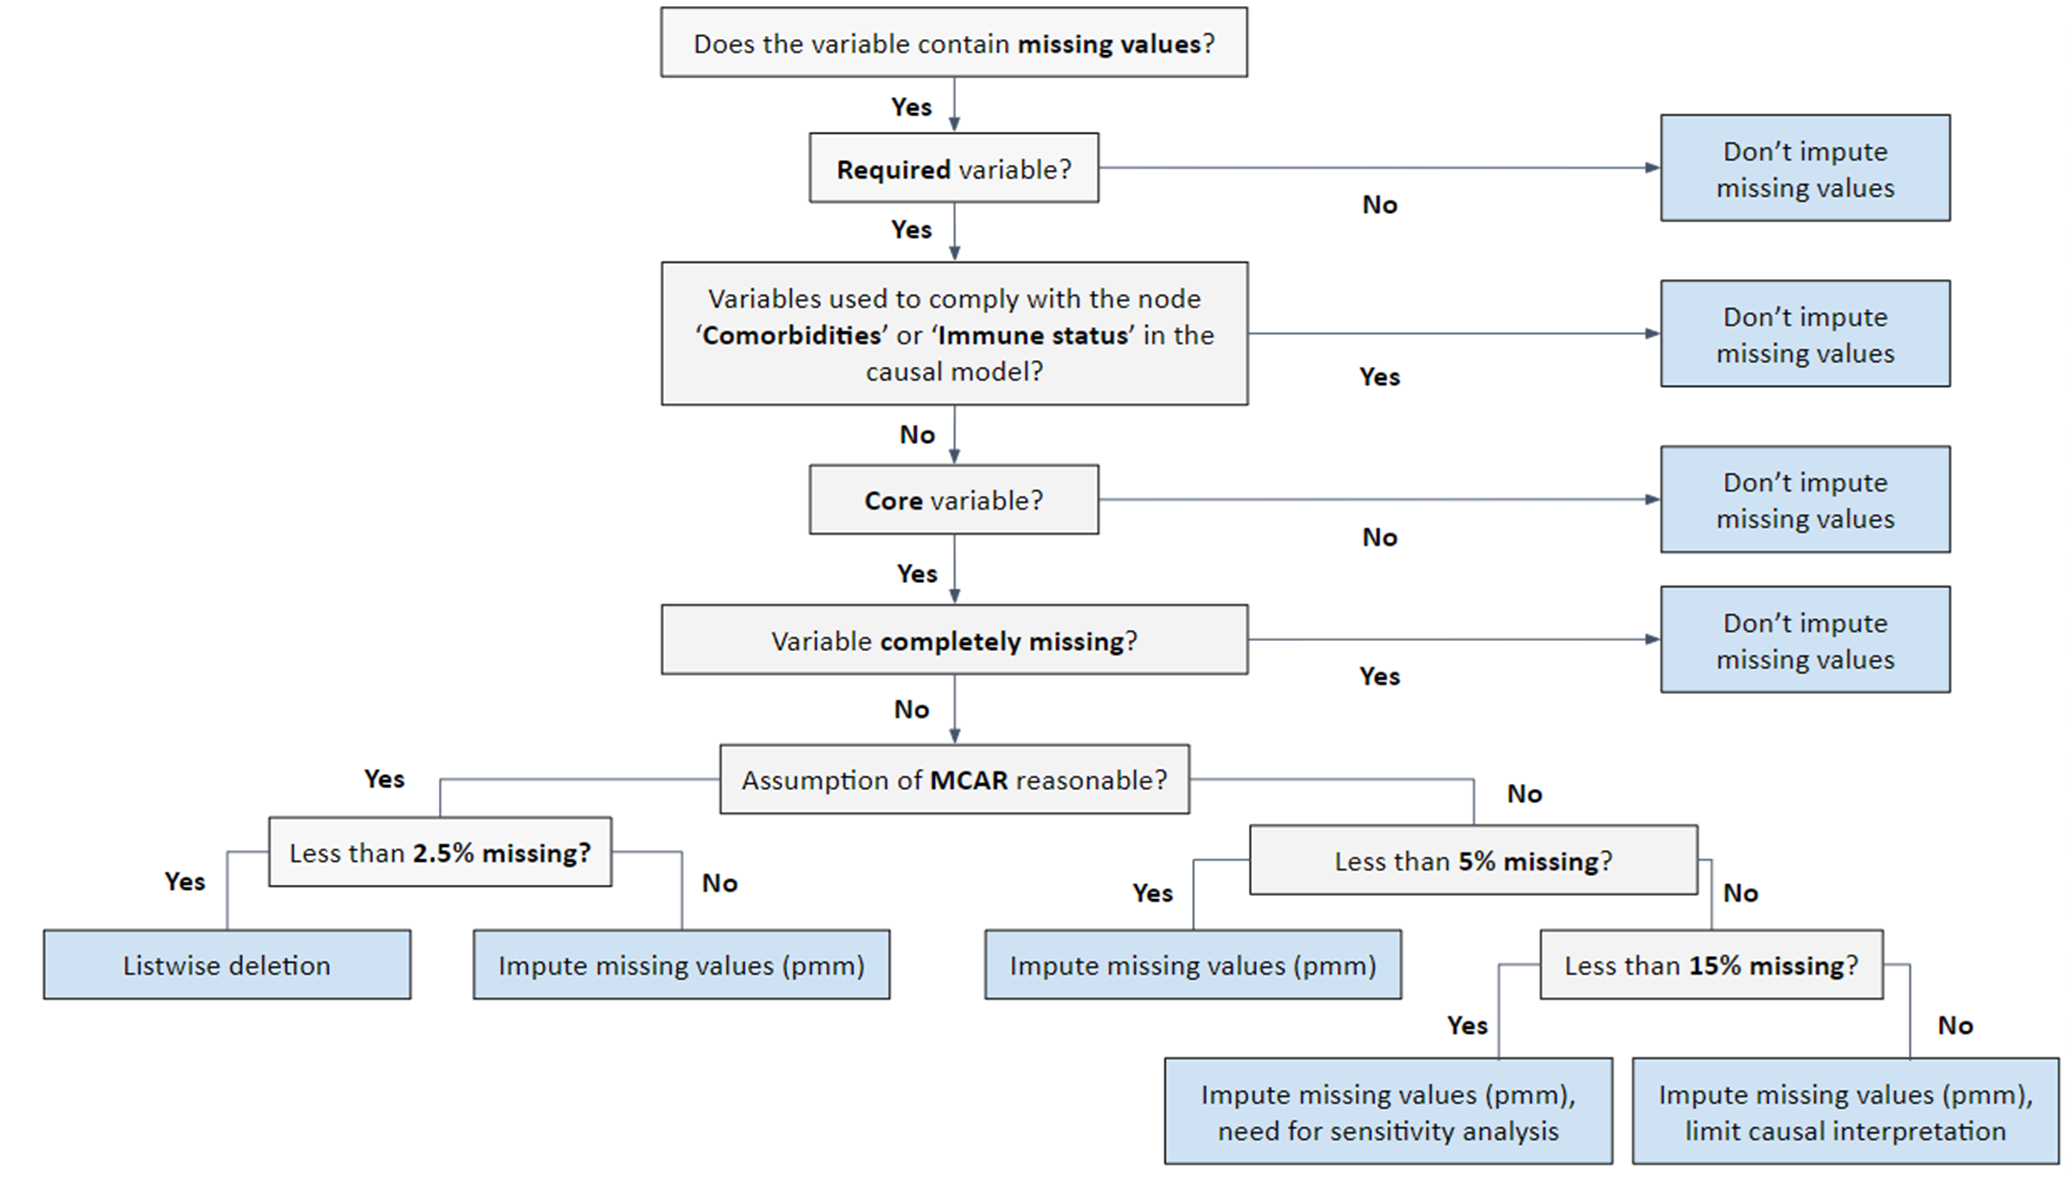
Figure 4. Decision tree for the imputation of missing data according to the variable. MCAR: missing completely at random.
Finally, the imputation process produces an interactive report as informative output on the MCAR/MAR/Non-MAR of the missing values in the core variable set in the input data, with a description of the number of registries imputed, the method followed and an overall assessment of the probability density distribution of the imputed variables compared with the original data (see an example in Figure 5 below).
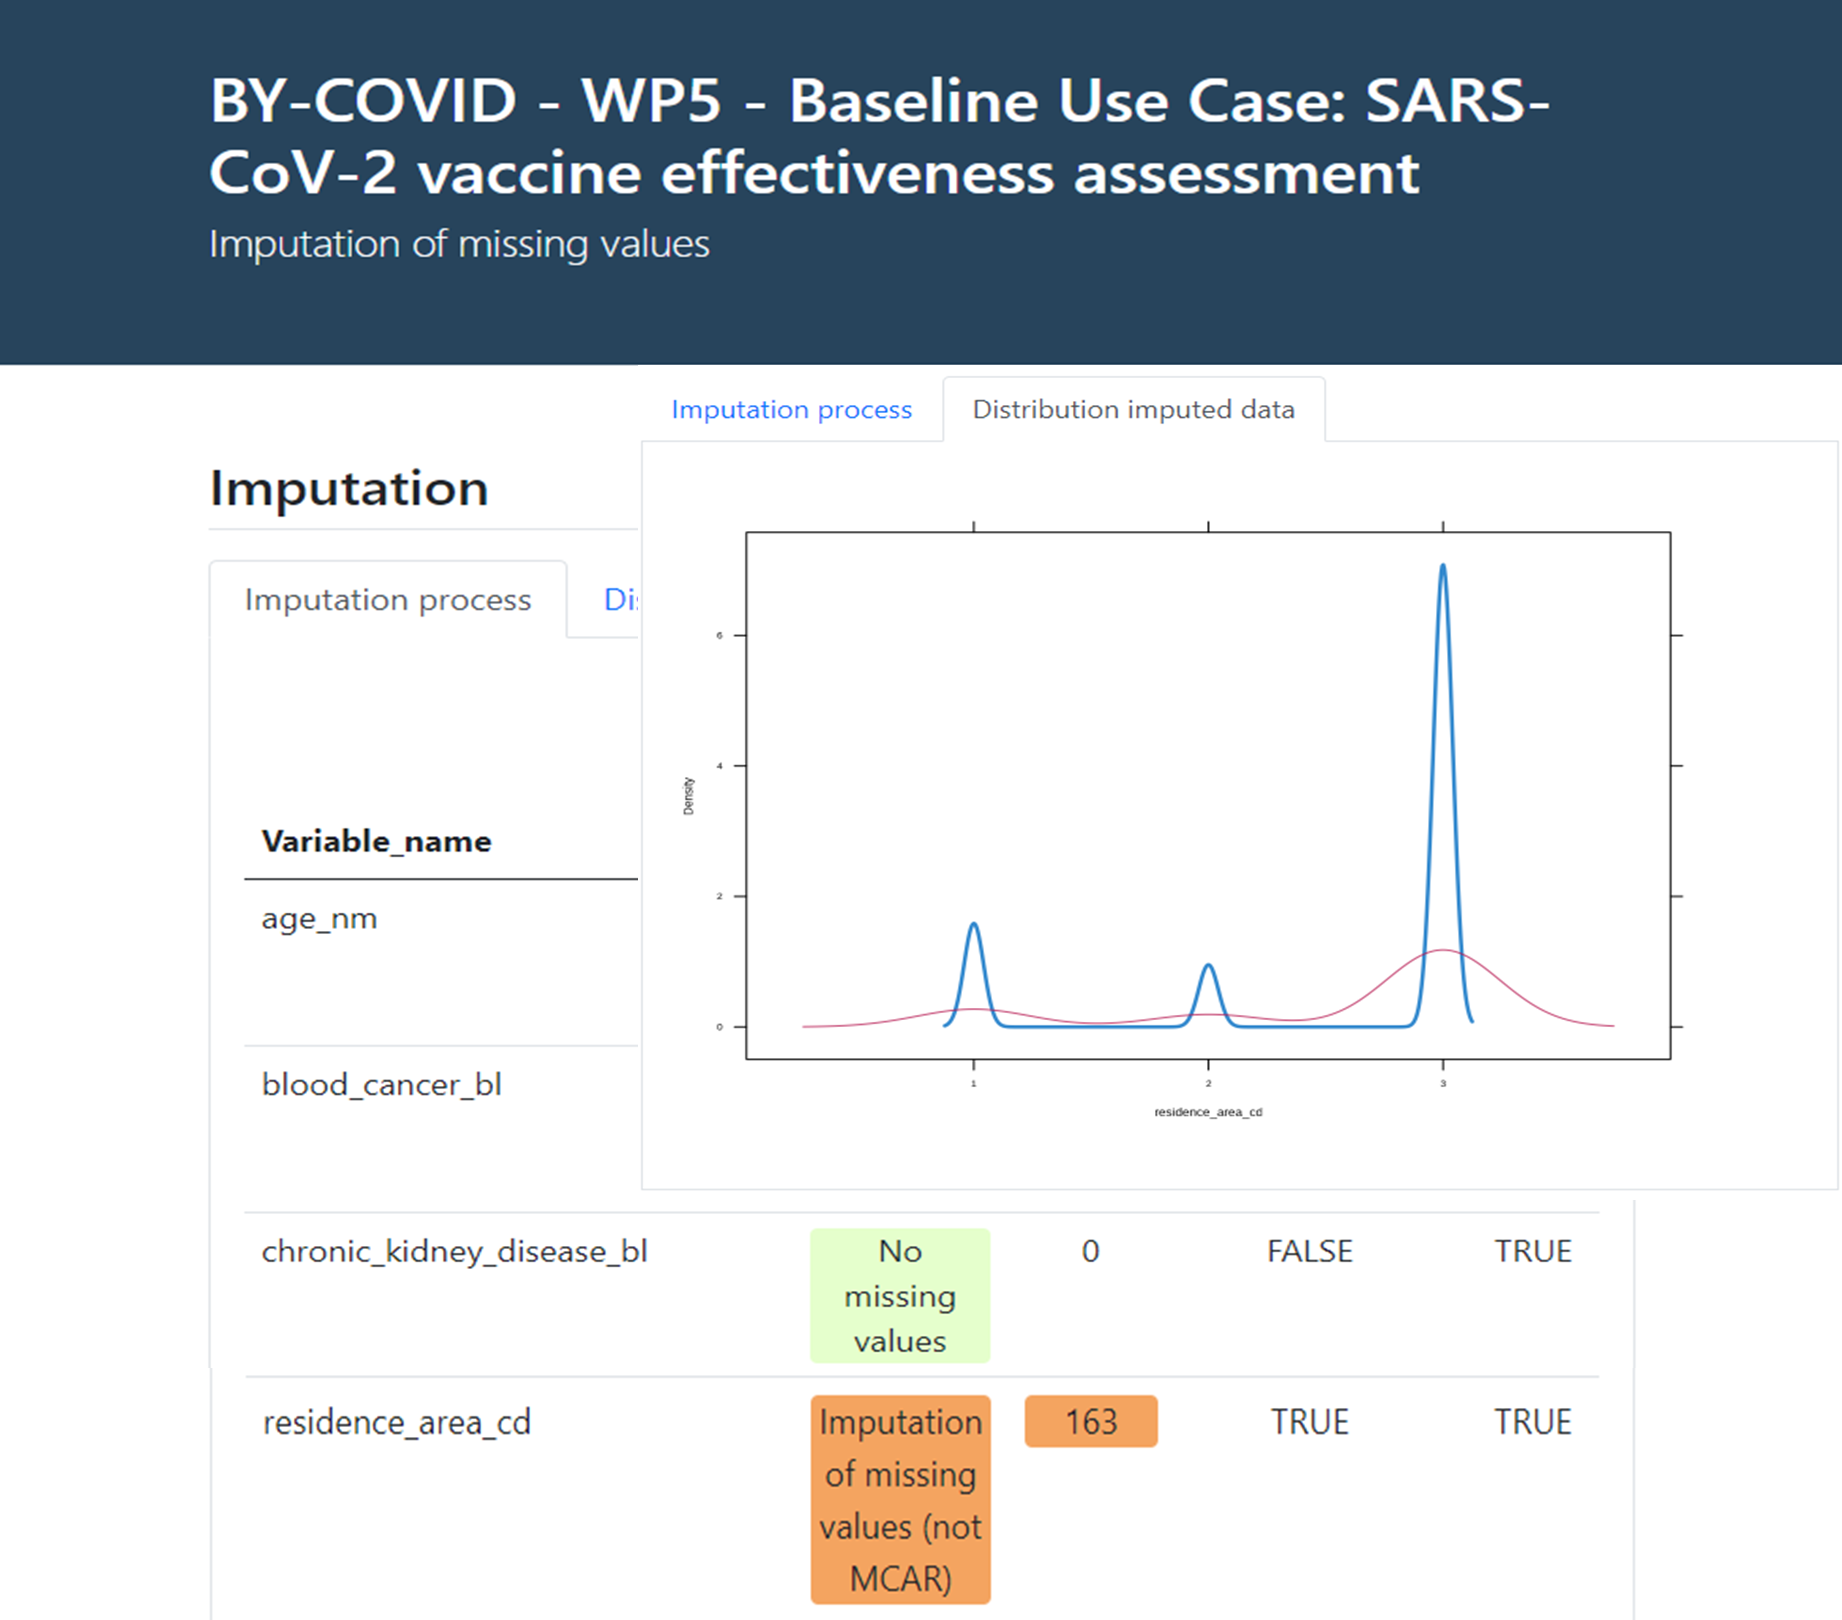
Figure 5. Imputation of missing values on core variables interactive report.
Comparing and/or pooling the local results
To integrate results across different populations, the aggregated non-sensitive statistics produced as local outputs of the analytical pipeline are shared and can be compared and/or pooled by the Coordination Node in the form of a meta-analysis.
What can you use the showcase for?
The proposed methodology can be applied to any well-defined population health research question and is generalisable to many situations, increasing preparedness for infectious diseases. It was demonstrated within the BY-COVID project by prototyping a workflow to assess the real-world effectiveness of SARS-CoV-2 primary vaccination compared to partial or no vaccination in preventing SARS-CoV-2 infection in populations spanning different countries. The research question was defined (step 1) following the PICOT strategy, and a study protocol was developed to provide a plan of action containing the study objectives and planned methodology. Subsequently, the Directed Acyclic Graph (DAG), Common Data Model (CDM) and synthetic dataset (steps 2, 3 and 4), together with all supporting research objects (see Figure 6), were developed and published on Zenodo.
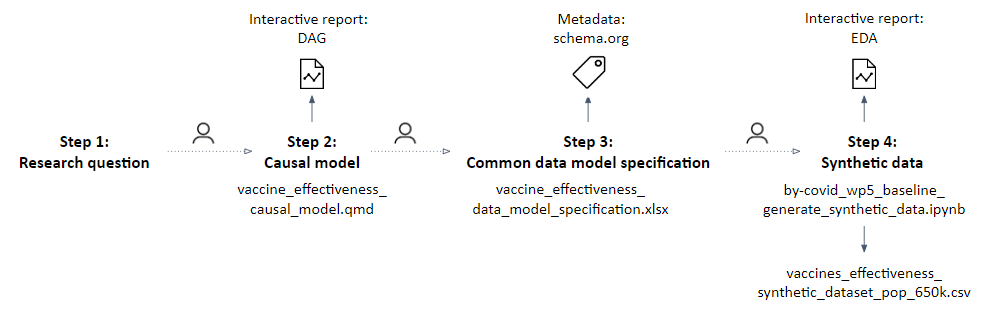
Figure 6. Overview of the executed steps and produced research objects during the implementation of the proposed methodological approach steps 1 to 4. Source: https://doi.org/10.1186/s12874-023-02068-3.
An analytical pipeline was developed and tested with the support of the synthetic data (step 5) using the R statistical programming language as sequential Quarto documents (.qmd files) reflecting and reporting the outputs of different modules (see Figure 7): thus, (1) Data Quality Assessment (DQA) of the original input data, (2) validation of the original input data to check compliance with the Common Data Model (CDM), (3) imputation of missing data where required, (4) iterative matching of the exposed to unexposed individuals and a balance assessment of the matched population, (5) a descriptive analysis of the matched and unmatched study population, and (6) a survival analysis in the matched study population. A detailed documentation of the statistical methods, as well as a README file guiding users on the script deployment, accompanies the statistical scripts in a dedicated GitHub repository.
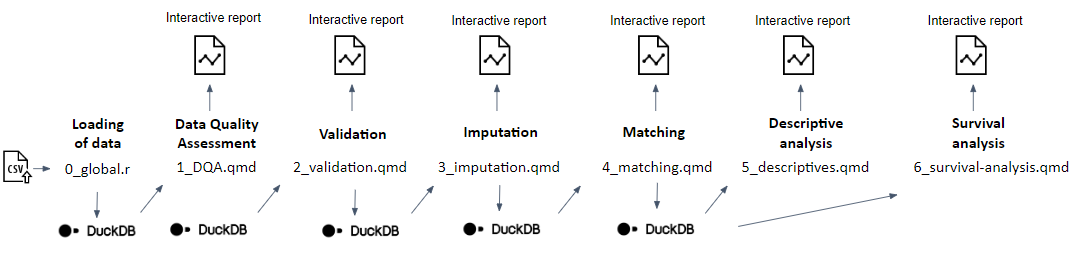
Figure 7. Graphical overview of the developed analytical pipeline, consisting of different subsequent modules, each producing an interactive report. Source: https://doi.org/10.1186/s12874-023-02068-3.
A detailed description of the security measures that will be implemented to prevent unauthorised access to personal data within the secured processing environments (SPEs) of each of the Participating Nodes, as well as a description of the anonymisation/pseudonymisation techniques that will be implemented, is provided in the published Data Management Plan (DMP).
The local outputs produced by each Participant Node and the comparative analysis, i.e., interactive reports of each main step of the analytical pipeline within each site as well as the SARS-CoV-2 vaccine effectiveness comparative analysis results across sites, have been published.
Publication
- Meurisse, M., Estupiñán-Romero, F., González-Galindo, J. et al. (2023) Federated causal inference based on real-world observational data sources: application to a SARS-CoV-2 vaccine effectiveness assessment. BMC Med Res Methodol 23, 248. https://doi.org/10.1186/s12874-023-02068-3
Acknowledgments
The work was executed as part of the BeYond-COVID project, more specifically within the context of one of the project’s use cases.
Contributors: Nina Van Goethem, Enrique Bernal-Delgado, Francisco Estupiñán-Romero, Marjan Meurisse, Javier González-Galindo, Natalia Martínez-Lizaga, Santiago Royo-Sierra, Simon Saldner, Lorenz Dolanski-Aghamanoukjan, Alexander Degelsegger-Marquez, Stian Soiland-Reyes, Markus Perola, and Teemu Paajanen.
Participant nodes: Sciensano (Belgium), IACS (Spain), THL (Finland), and GÖG (Austria).
We also want to acknowledge the participation and feedback from Vasso Kalaitzi (KNAW/DANS), Claudia Habl (GÖG), Gunter Maier (GÖG), Mirjam Knol (RIVM), Chantal Reusken (RIVM), Mariken Tijhuis (RIVM), Leon Schutte (RIVM), Kati Kristiansson (THL), Pekka Jousilahti (THL), Jostein Starrfelt (NIPH), Hinta Meijerink (NIPH).
More information
Training
Tools and resources on this page
| Tool or resource | Description | Related pages | Registry |
|---|---|---|---|
| DAGitty | DAGitty is a browser-based environment for creating, editing, and analyzing causal diagrams (also known as directed acyclic graphs or causal Bayesian networks). | Tool info Standards/Databases | |
| Quarto | Quarto is an open-source scientific and technical publishing system that enables the creation of dynamic and reproducible content. | Training |


IACS

UCLouvain